Surveying a (still) unknown world
It is three o’clock in the morning as the shrill sound of my mobile phone alarm wakes me from my dreams. It seems to have woken up my roommate too, as I hear movement and rustling in the bed above me. I therefore quietly sneak out of bed and twelve minutes later I am standing ready for action in the brightly lit corridor outside our cabin.
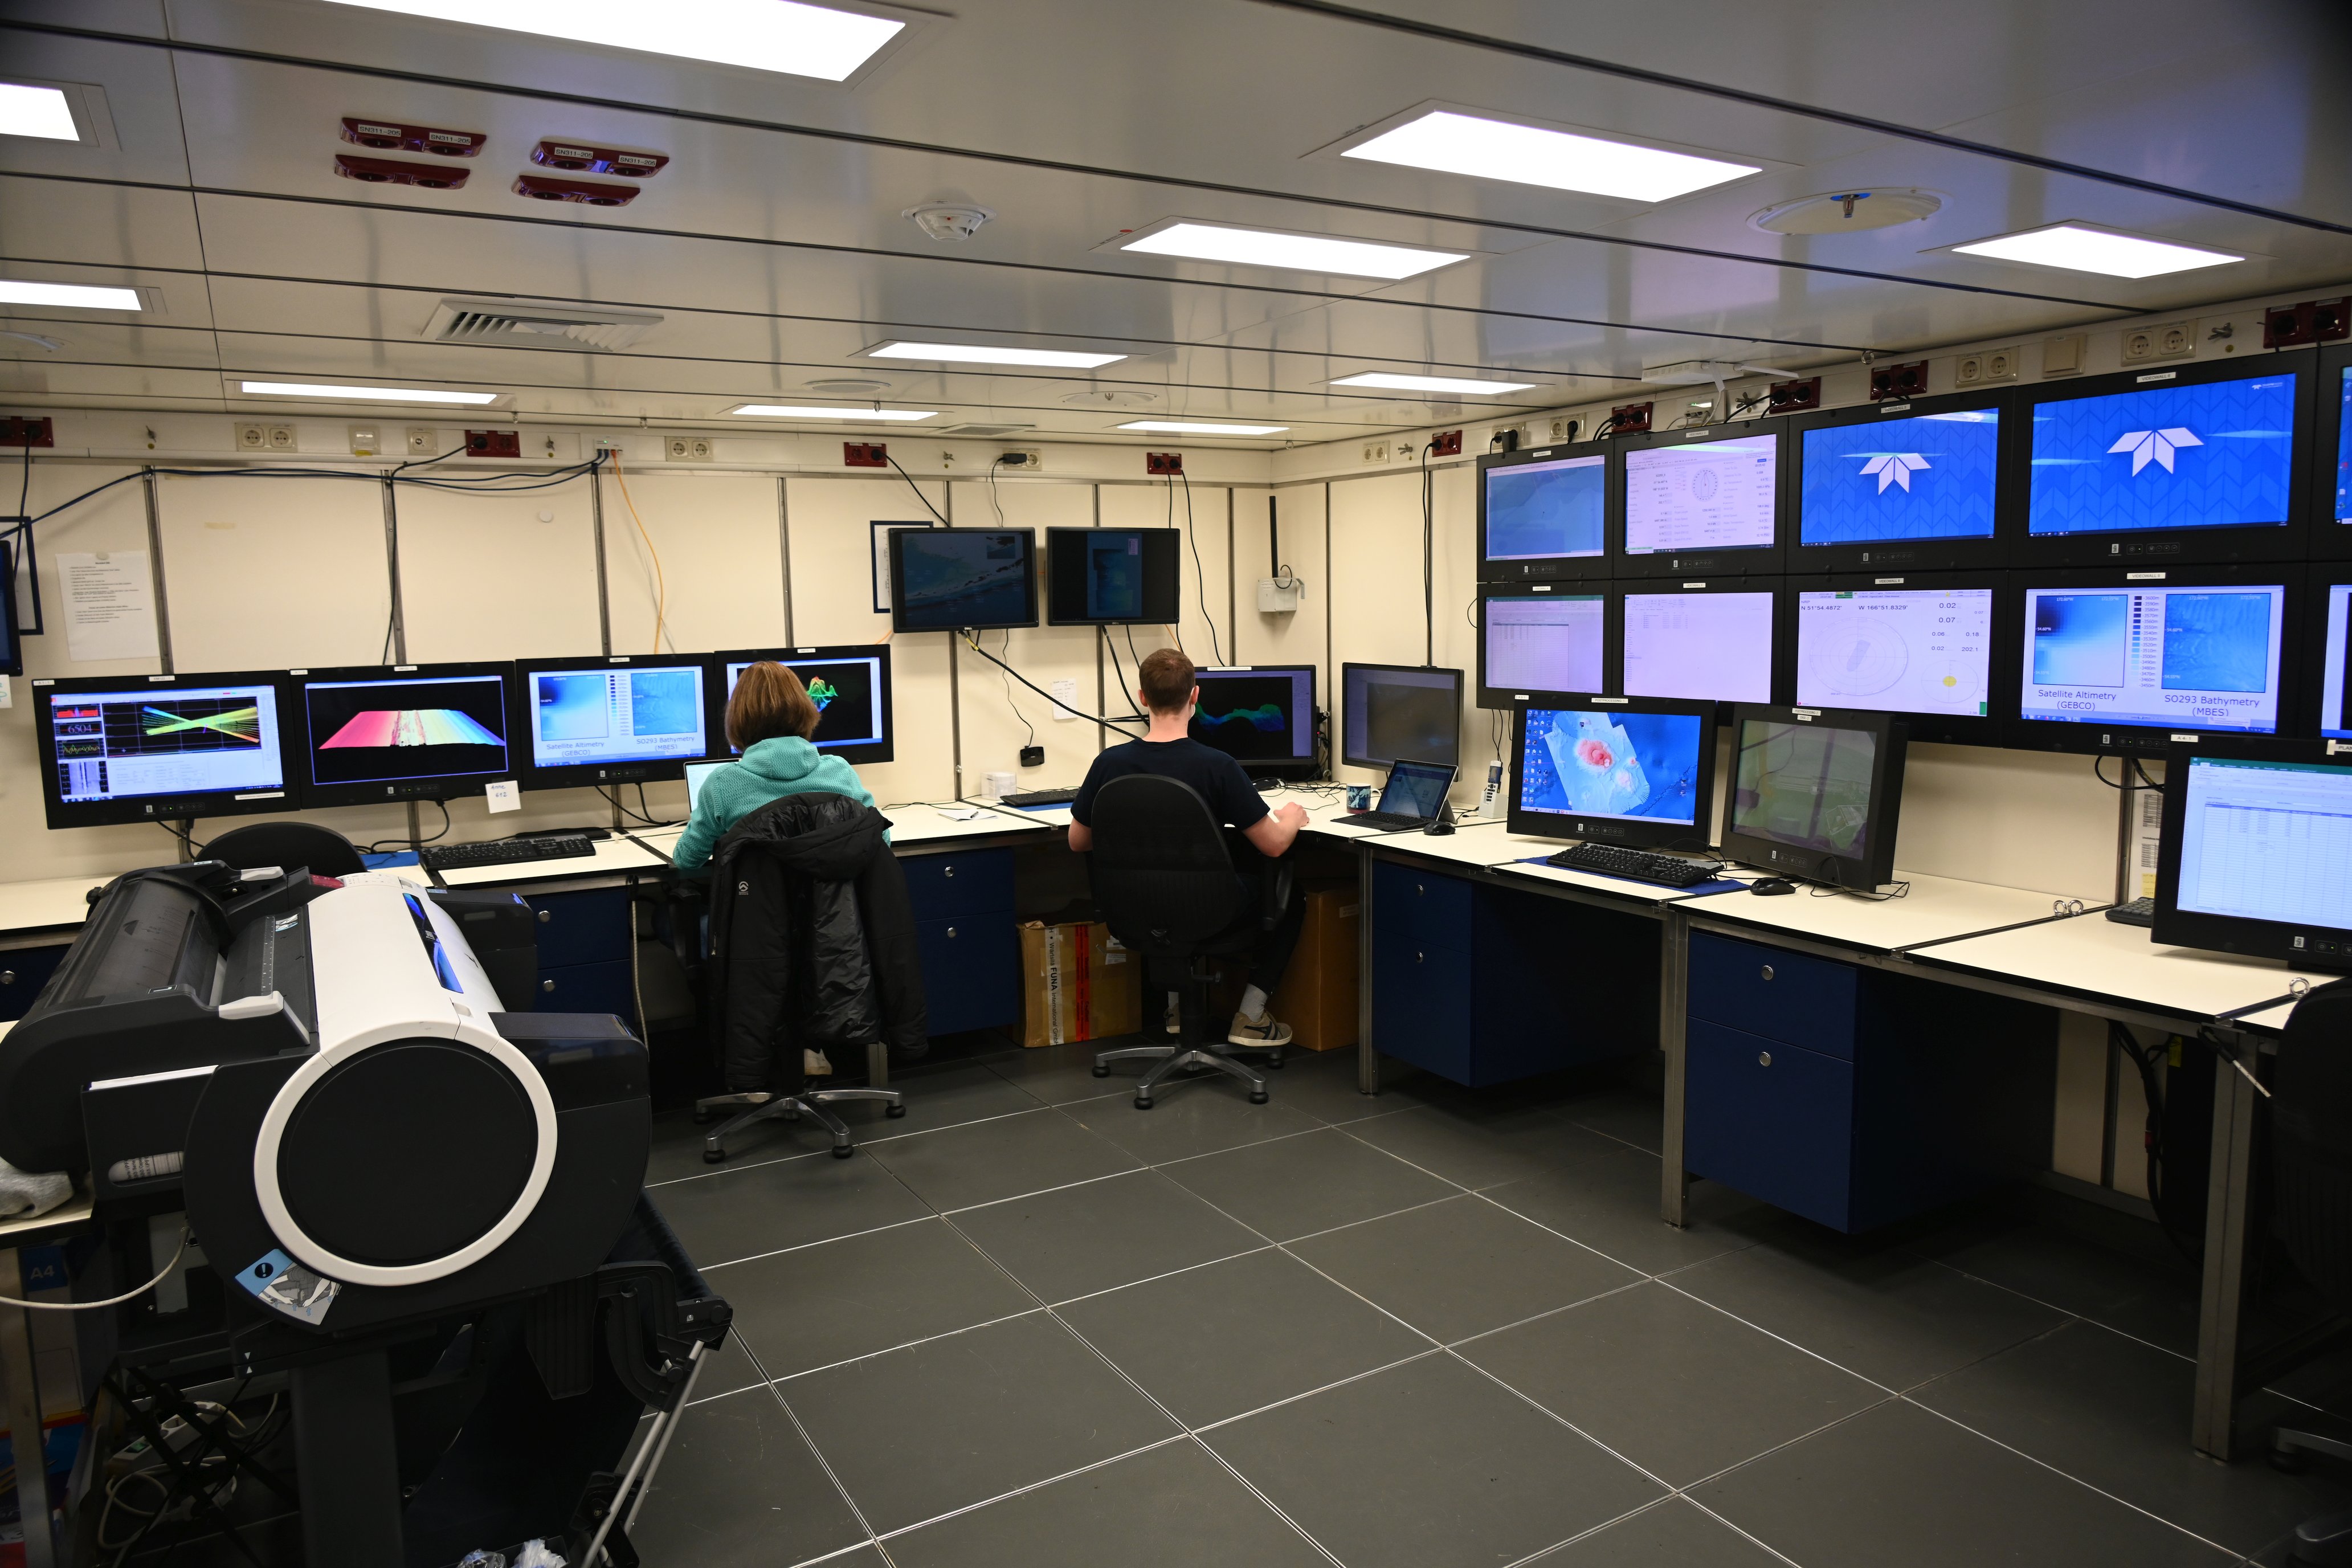
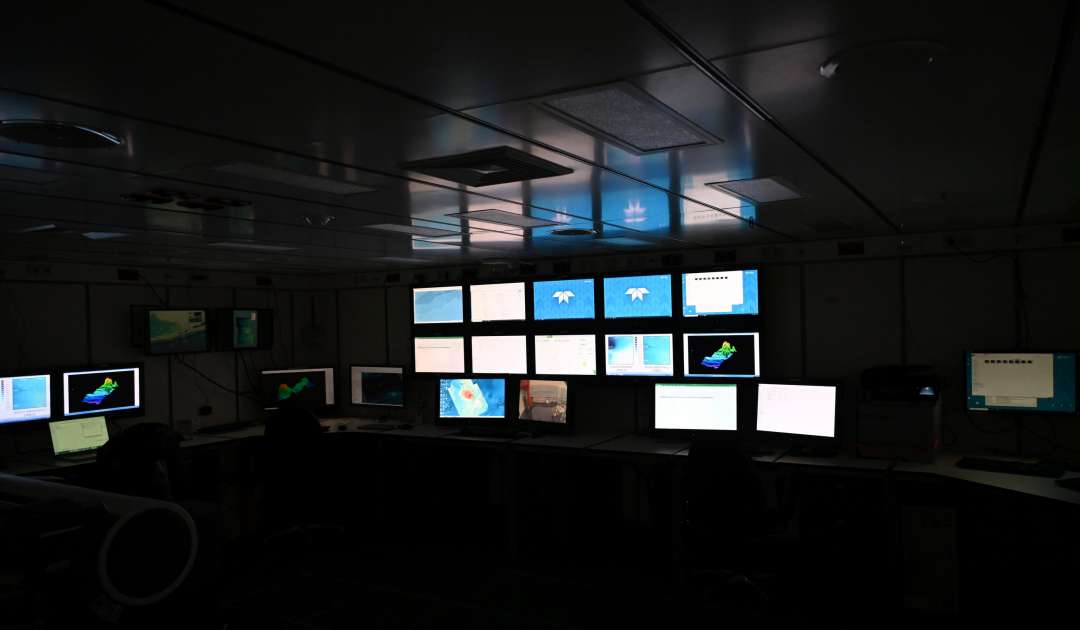
The hydroacoustic lab we are working in, which could have come out of a Hollywood movie because of its two dozen screens, seems almost peaceful as I glance through the door. The CTD lab, on the other hand, is already bustling with activity. A glance at the display tells me that the probe is at a depth of 3,800 m and on its way back to the surface. So, there is still time for a quick breakfast …
The data from the CTD sensors are important for our work because the measured depths, temperatures and salinities can be used to calculate the speeds at which the sound waves of the multibeam echo sounder propagate. Using these sound velocity profiles and the measured travel times of the sound (from the ship to the seabed and back), our system later automatically calculates the depths that we use to create maps of the seabed.
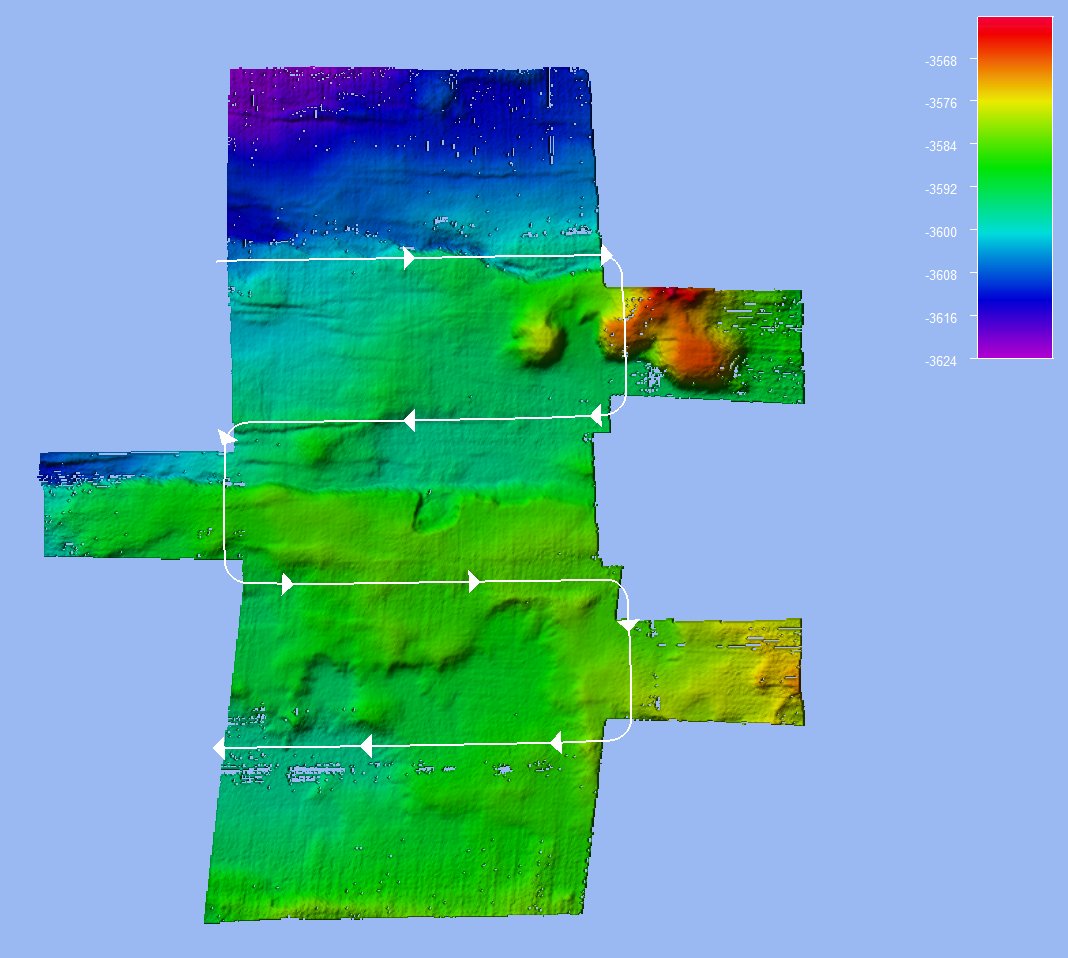
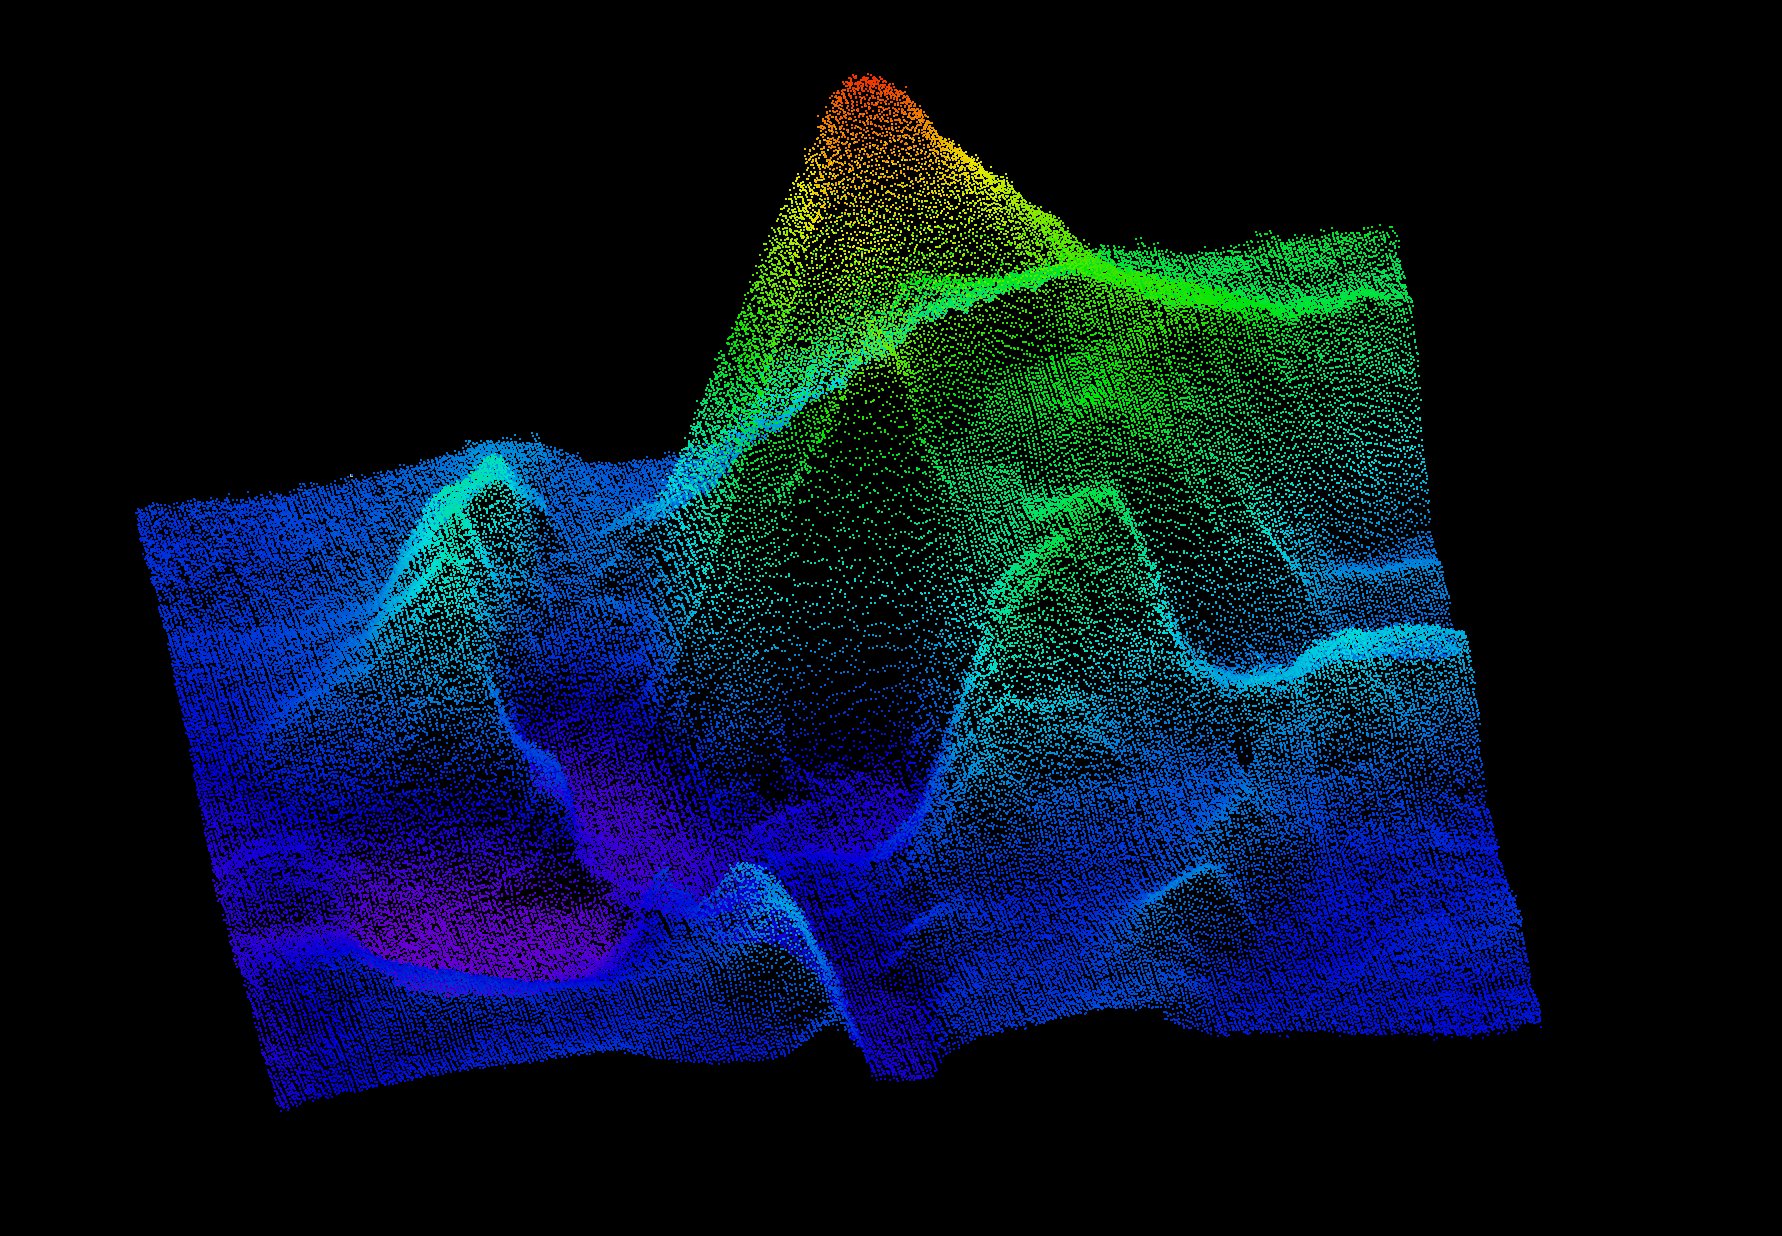
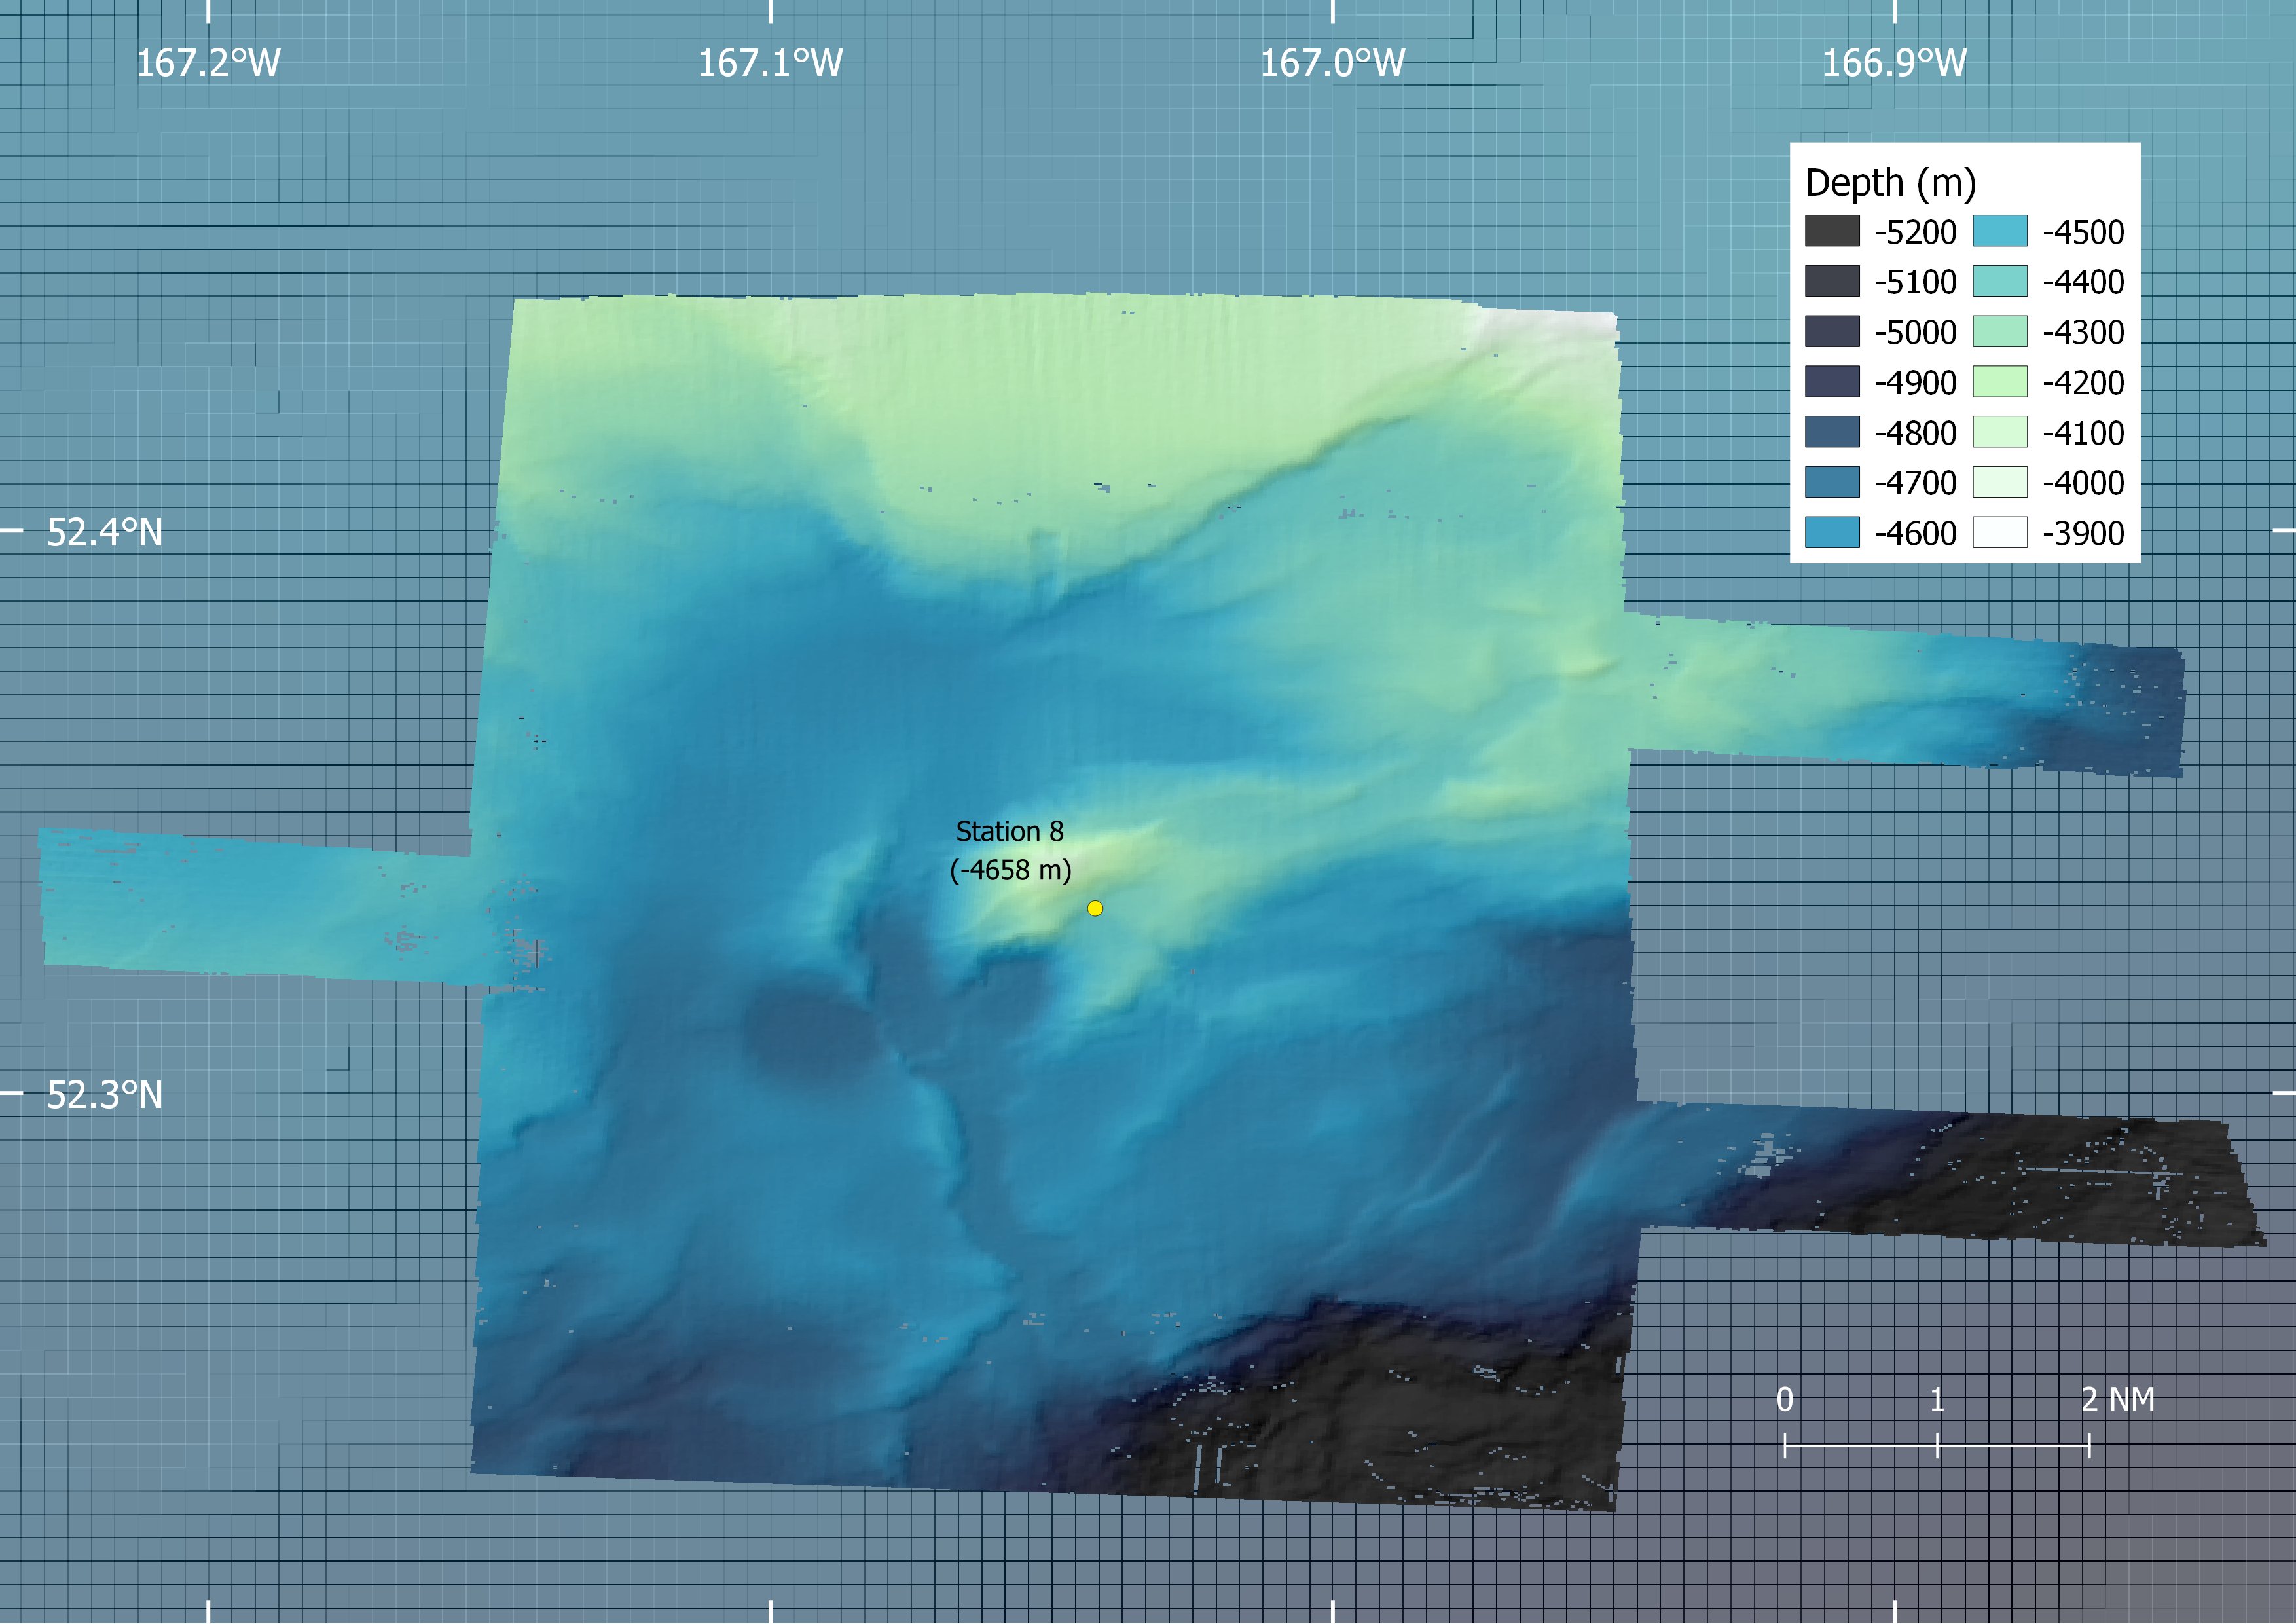
Two slices of wholemeal bread with cheese and cucumber as well as a cup of coffee later, I enter the hydroacoustic lab for the first time that morning, breaking the silence. The CTD is now back on deck and the ship has set course for the starting point of the survey. It is 5:26 a.m. as the nautical officer answers the radio and gives the start signal. From now on, the RV Sonne travels several parallel paths at seven knots, enabling us to map an area of 7 x 7 nautical miles (approx. 13 x 13 km) with a resolution of about 100 metres. After a few seconds the first series of depth measurements appear on one of the 31 monitors and only thirty minutes later the first file with over 100,000 data points is ready for processing. The 3D model of a landscape that no human has ever seen before builds up in front of me.
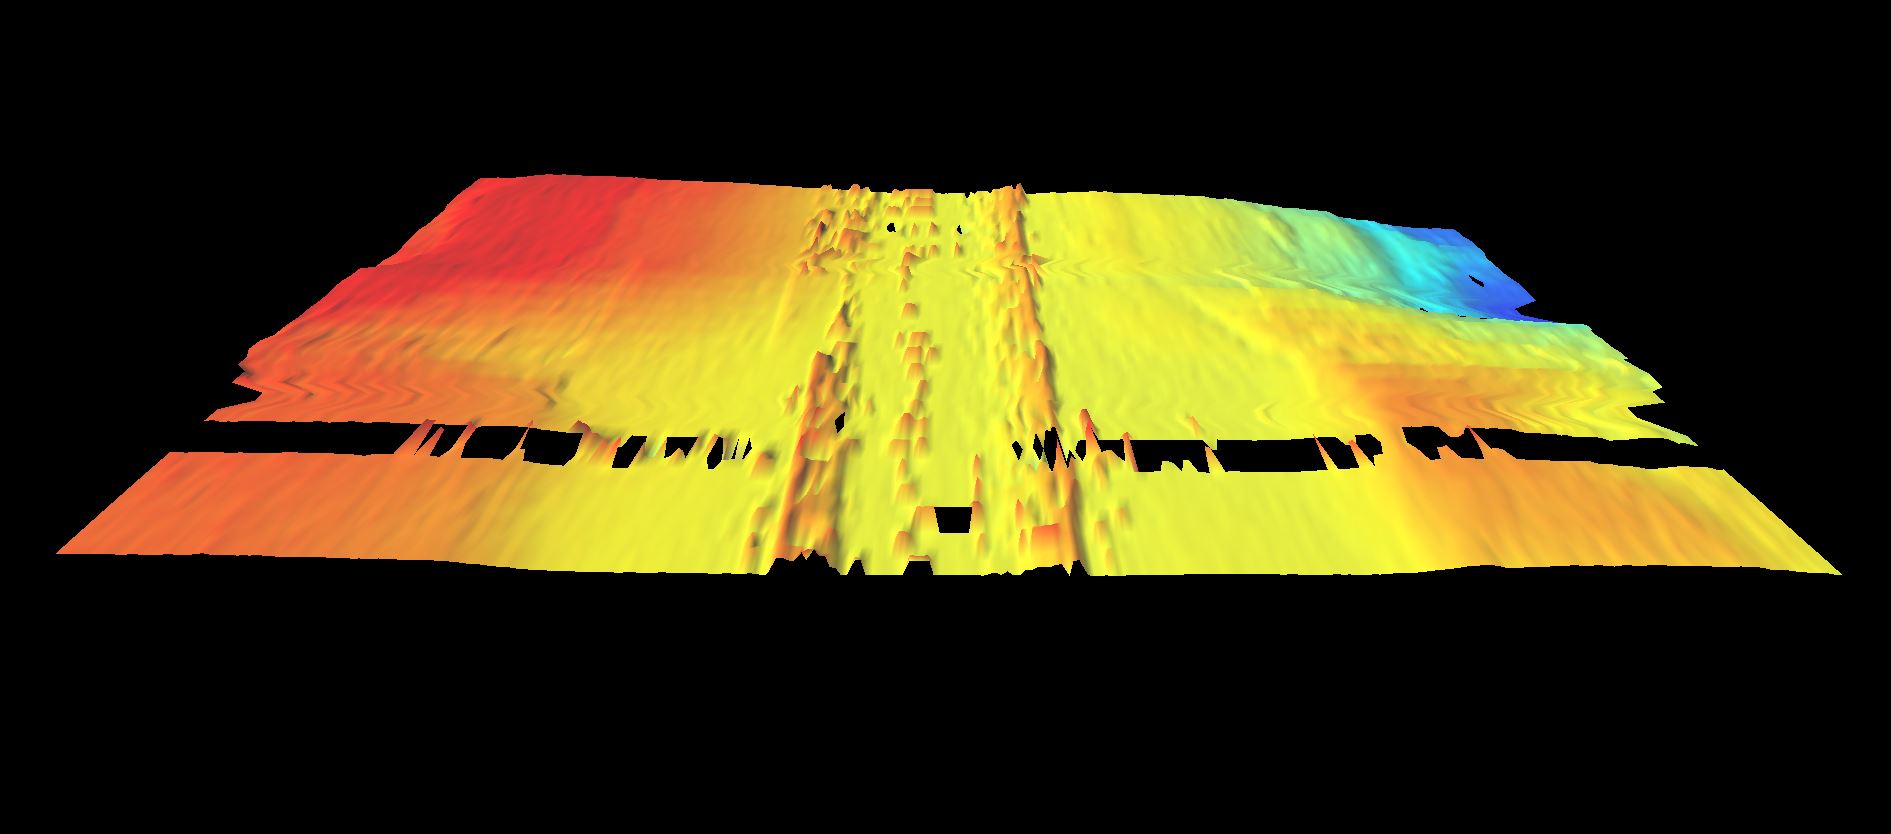
As with every scientific measurement, errors also occur in bathymetry. For example, fine-grained, water-saturated sediments cause horn-like structures to appear at regular intervals parallel to the direction of travel. Strong swells, on the other hand, can cause the multibeam echo sounder to briefly fail in detecting the seabed, resulting in holes or gaps. Therefore, we observe the data carefully during the measurement, adjust the instrument settings to the environment if necessary and remove the remaining erroneous data, which in technical jargon are called artefacts and outliers.
It is 11:21 a.m. when the bridge announces by radio that we are now on the last lane of the survey. As I put the radio aside, my colleague enters the lab. She was responsible for the survey during the journey to the station last night, but still looks rested and fit. Now it has to be quick: I clean up the last data packets and create a map of the entire station area, while my colleague takes care of evaluating the backscatter. This gives us information about the surface composition of the seabed – hard rock or soft sediment.
No sooner have we finished processing the data than the heavy door of the laboratory opens and the instrument technicians enter the realm of bathymetry. Within a few minutes, in a sometimes heated but always goal-oriented discussion, the locations for deploying the instruments are determined, before silence returns to the windowless room. Over the next few days we will continue to process the data for publication and plan the mapping of the next station, but for now we have earned a break. We will need it, as 80 % of the global seabed is still waiting to be mapped by us.